Kyan Hsu Portfolio
Exploring the intersection of business and AI through innovative projects and skills development.
My Projects
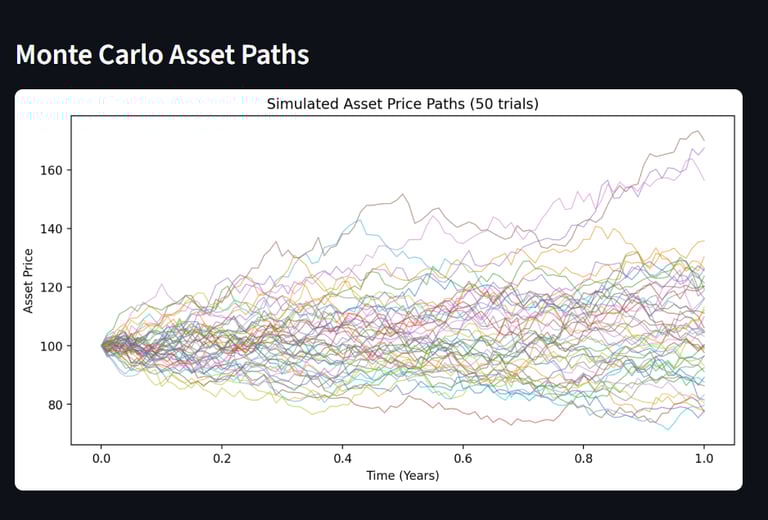
An interactive tool for pricing American options using a binomial tree approach, finite difference, and the Heston model. Incorporated Monte Carlo simulations to visualize stochastic asset price paths and to demonstrate price behavior under uncertainty.
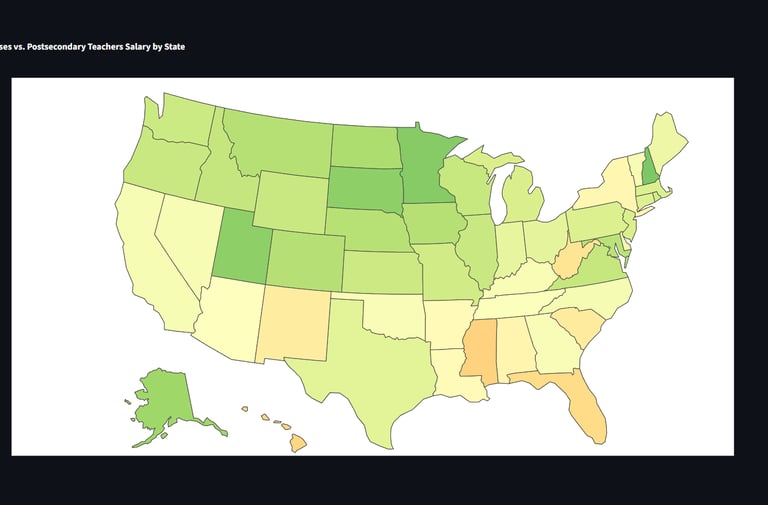
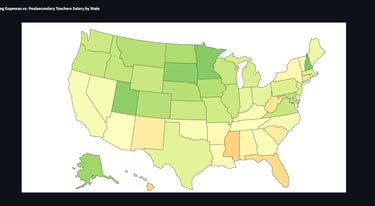
Visualizes the relationship between household income, living expenses, job salaries, and state tax rates across U.S. states. It reads data from CSV files. The app allows users to select a career and view a choropleth map and bar charts that show the income-to-expenses ratio by state, making it easy to compare affordability. Users can interact with the map to see detailed state information.
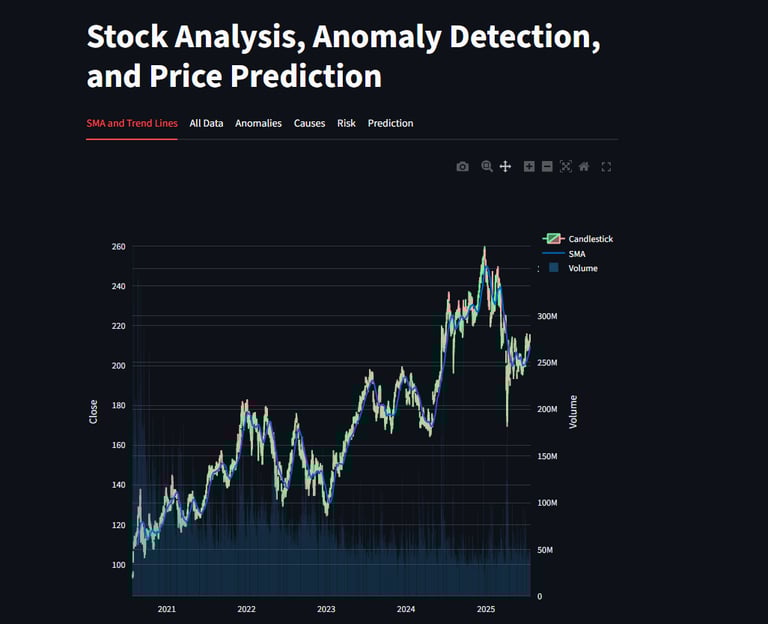
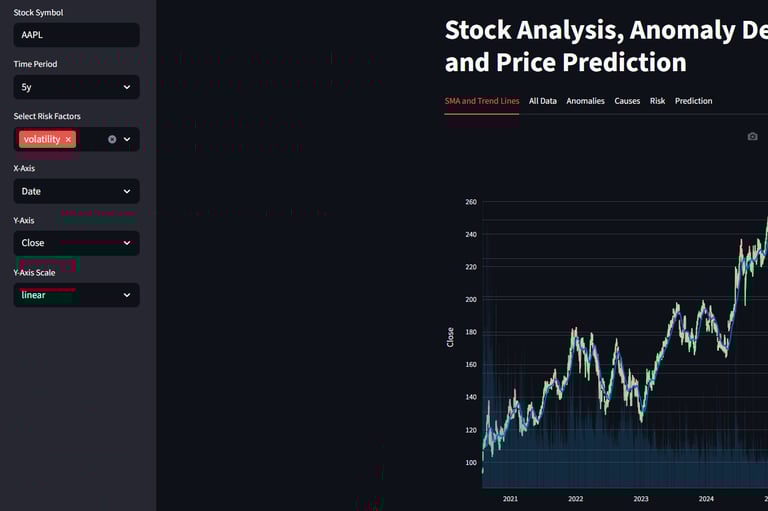
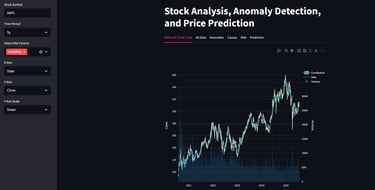
Detects anomalies, makes predictions, and calculates risk factor. Dashboard application designed for real-time visualization of stock market trends, anomaly detection using machine learning algorithms, and predicting future stock prices based on regression .
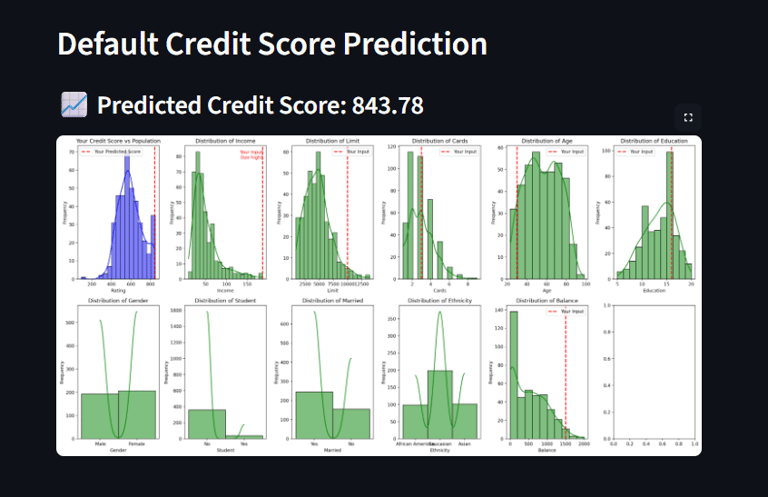
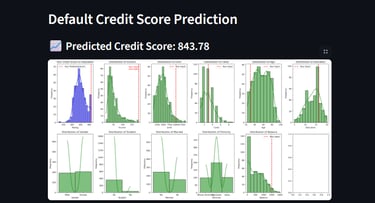
This application performs several tasks related to credit score prediction. It also uses data visualization to display data a digestible format. *Instead of credit score, the program can be trained on almost anything, given the data in a csv format. You can use this to predict products customers are likely to like, trends of a certain demographic, and how someone compares to others.
Income Vs State Expense
Monte Carlo
Stock Dashboard
US Affordability Map
Regression Analysis
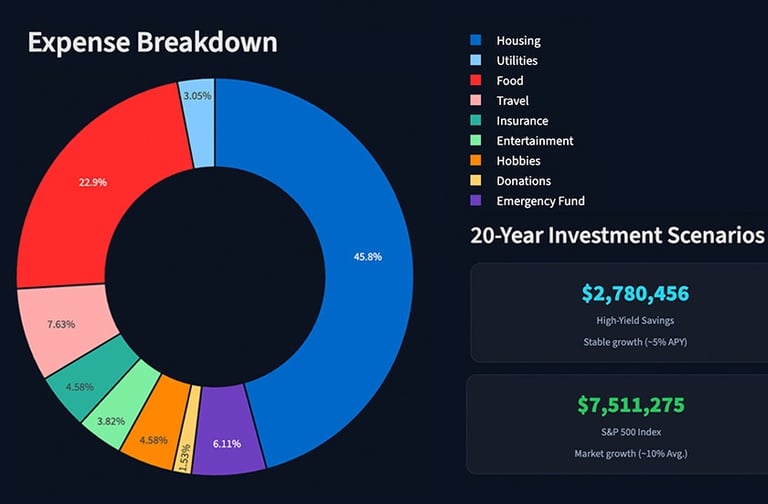
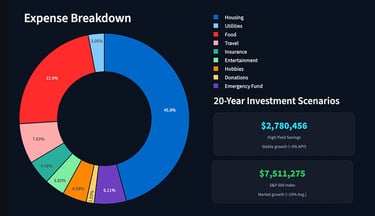
Financial Planner
I coded this financial dashboard that helps users track their income, expenses, savings, and investments. It shows whether they’re on track for retirement, breaks down monthly spending, compares long-term investment scenarios, and provides quick financial tips.